


I
Introduction
A crucial skill for ESG (Environmental, Social, and Governance) leaders and foundation executives is the ability to discern between ego-stroking statistics and practical insights. This is especially crucial in an environment of growing stakeholder scrutiny, regulatory pressure, and a heightened awareness of greenwashing. Modern technology is becoming more and more necessary to transition from vanity metrics to continuous impact management. Also, annual compliance is giving way to continuous learning systems in impact reporting.

The concepts of The Lean Startup and its focus on validated learning have had a significant impact on the movement in CSR toward actionable reporting. The Actionable Metric, which offers a direct route to better decision-making, is the antidote, according to Eric Ries, who first used the term vanity metrics. All in all, a metric must meet the three A’s to be genuinely beneficial to a corporate foundation. It must be actionable, accessible, and auditable.
II
Defining the Mirage: The Ontology of Vanity Metrics in Philanthropy
In the technology industry, the phrase vanity metrics became widely used to characterize statistics that provide a sensation of advancement without increasing organizational impact or guiding future strategy. These metrics frequently take the form of raw totals in the context of corporate foundations and CSR. Examples may include the number of beneficiaries reached, the amount of funds provided, or the number of volunteer hours.

Although these numbers measure the degree of charity or dedication, they do not show the true value created for the community. Its defining characteristics are the vanity metric’s basic lack of context, ease of manipulation, and simplicity. For instance, a foundation may state that 100,000 trees were planted thanks to funding from its environmental program. Although the figure is high and seems advantageous, it might be considered a vanity metric if it doesn’t take into consideration the long-term carbon sequestration attained, the survival rate of those trees, or the restoration of local biodiversity.
Vanity metrics frequently conceal systemic flaws or inefficiencies in a program’s design. This gives users a false sense of security. Leadership may believe that a strategy is effective even if the underlying societal issues they are trying to address continue or get worse. Corporate foundations, which function at the nexus of social welfare and commercial reputation, are especially vulnerable to this gap.
When reporting is shallow, it can lead to charges of greenwashing because stakeholders want more than just activity; they want evidence of real transformation.
III
Critical Statistics on Vanity Metrics
In this section, we will provide crucial statistics that prove the use and impact of vanity metrics within organizations.
a. False engagement metrics
Marketers admit that engagement and audience delivery metrics, which include likes, impressions, and other vanity data, do not accurately reflect organizational impact. However, they were among the most popular metrics employed by marketers in a 2022 industry poll, and their use has increased annually. In contrast, the use of real outcome indicators (such as ROI, profit, and customer lifetime value) decreased throughout the same time period. This indicates a continued dependence on superficial measurements despite claims that organizations wish to link performance to outcomes.
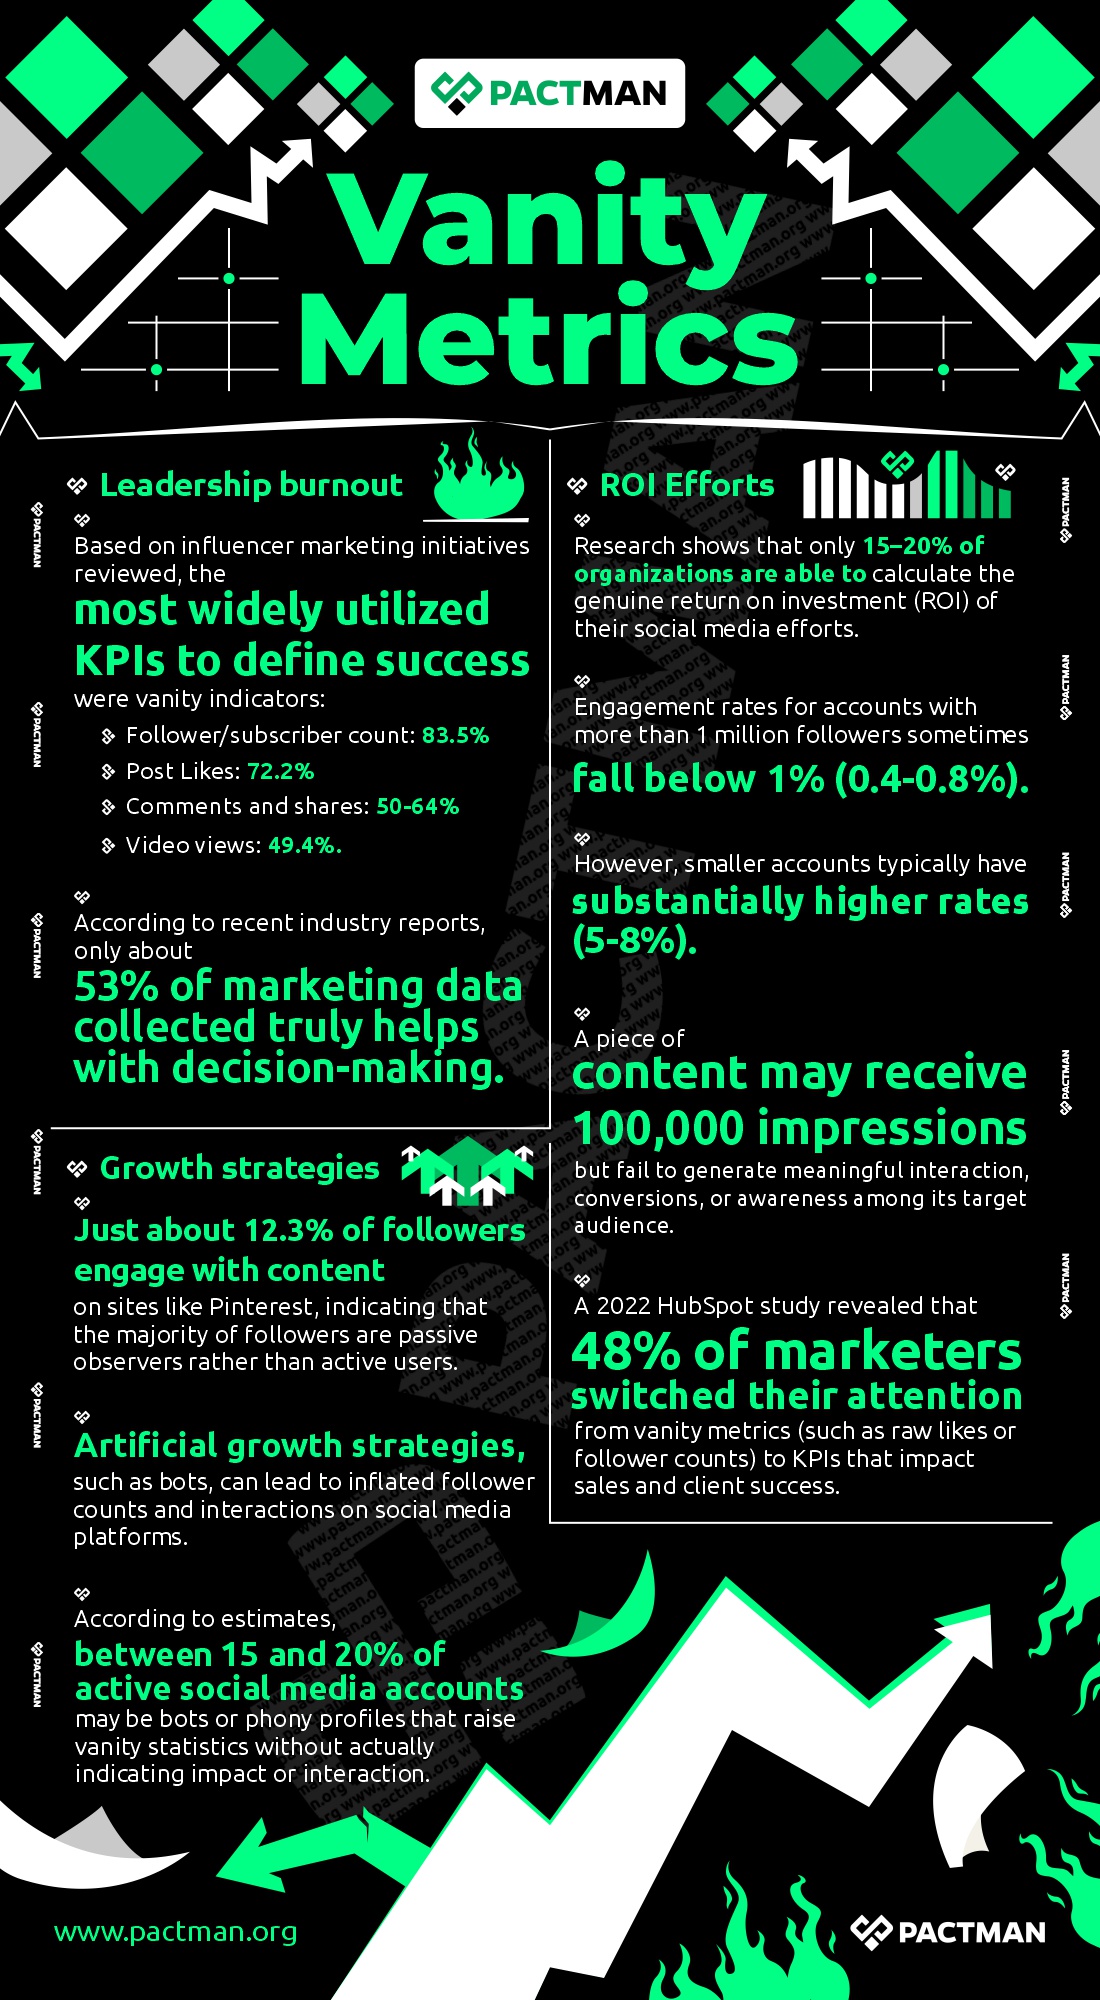
Based on influencer marketing initiatives reviewed, the most widely utilized KPIs to define success were vanity indicators:
- Follower/subscriber count: 83.5%
- Post Likes: 72.2%
- Comments and shares: 50-64%.
- Video views: 49.4%.
Also, according to recent reports, only about 53% of marketing data collected truly helps with decision-making. Marketers often monitor metrics that have little bearing on business decisions.
b. ROI Efforts
Research shows that only 15–20% of organizations are able to calculate the genuine return on investment (ROI) of their social media efforts. This means that the majority are not linking metrics such as likes and follows to real commercial impact.
Engagement rates for accounts with more than 1 million followers sometimes fall below 1% (0.4-0.8%). However, smaller accounts typically have substantially higher rates (5-8%). Also, a piece of content may receive 100,000 impressions but fail to generate meaningful interaction, conversions, or awareness among its target audience.
A 2022 HubSpot study revealed that 48% of marketers switched their attention from vanity metrics (such as raw likes or follower counts) to KPIs that impact sales and client success.
c. Growth strategies
Studies conducted by academics on social media platforms demonstrate that a significant percentage of followers do not actively connect with content. For instance, just about 12.3% of followers engage with content on sites like Pinterest, indicating that the majority of followers are passive observers rather than active users.
Also, artificial growth strategies, such as bots, can lead to inflated follower counts and interactions on social media platforms. According to estimates, between 15 and 20% of active social media accounts may be bots or phony profiles that raise vanity statistics without actually indicating impact or interaction.
IV
The Strategic Need of the Logic Model: Going Beyond Results
To transcend vanity metrics, organizations must distinguish between the different stages of an intervention using a logical hierarchy. This hierarchy, which includes inputs, actions, outputs, results, and impact, acts as a road map for evaluating the success of charitable and sustainable projects.

The resources that a business invests in, like personnel time, money, and technology, are known as inputs. What is done with such resources, like holding workshops or granting awards, is called an activity. The countable results of those activities, such as the quantity of meals delivered or the number of individuals trained, are known as outputs. Although outputs are simple to monitor and report, they constitute a vanity trap since they don’t show whether anyone’s life has truly improved.
However, when foundations move toward results and impact, a crucial shift takes place. The intermediate impacts of the outputs, such as a quantifiable shift in beneficiaries’ circumstances, conduct, or level of knowledge, are known as outcomes. All in all, impact is the final, long-term systemic change, such as a notable increase in regional literacy or a net decrease in poverty.
Level |
Definition |
Philanthropy Example |
Nature Example |
| Input | Resources invested in the project. | $50,000 grant for a literacy program. | Funding for a reforestation initiative. |
| Activity | The work being performed. | Literacy workshops conducted weekly. | Planting native tree species. |
| Output | The direct, tangible products. | 500 students completed the course. | 10,000 trees successfully planted. |
| Outcome | Changes for stakeholders (behavior/skills). | 40% increase in reading comprehension scores. | Restoration of local soil moisture levels. |
| Impact | Long-term, systemic change. | Increased long-term economic mobility for graduates. | Net increase in regional biodiversity and carbon sink. |
Whether a foundation can demonstrate its impact is determined by the difference between output and outcome. A program that trains 250 people, for example, is reporting an output. On the other hand, the foundation is reporting an outcome if those 250 people go on to secure high-paying positions. A well-known example of this distinction is TOMS Shoes, which gave 95 million pairs of shoes (output). Although the results were outstanding, an outside study showed that the children who received them had negligible long-term health or self-esteem impact. Likewise, there was an unexpected consequence of increasing reliance on outside assistance.
V
Closing the Context Gap in CSR Data
When data is presented separately, it is nearly always deceptive. While an effective statistic demands context to communicate a meaningful story, a vanity metric can flourish in a vacuum. Organizations frequently assess outputs rather than outcomes, not because they favor shallow data. Rather, their current data architecture makes it difficult to do anything otherwise. This context gap arises when there is no way to connect a person’s engagement in an activity (output) to their long-term development (outcome). Hence, a structural change toward continuous learning systems is necessary for corporate foundations to close this gap.

Now more than ever, foundations are shifting to real-time feedback loops in place of retrospective annual reports. This entails giving stakeholders distinct identification so that their journeys can be tracked over time. Also, it combines qualitative narratives with quantitative data to comprehend the “why” behind the numbers.
Case Study 1: Mastercard and the Playbook for Societal Impact at Scale
Mastercard offers a groundbreaking example of how a corporate foundation can transition its reporting from traditional philanthropy to a scalable, data-driven model. The Mastercard Center for Inclusive Growth, which was established in 2013, pairs philanthropic capital with core business assets like data, technology, expertise, and networks. By 2024, the company had reached 960 million individuals and 65 million micro and small businesses, connecting them to the formal financial system.
Essentially, Mastercard’s process employs a “Test, Iterate, and Scale” approach to avoid conceit. This guarantees that, before their global expansion, interventions are supported by a thorough study. Also, based on the twofold materiality principle, their reporting evaluates the company’s financial risks and opportunities in addition to its impacts on society and the environment. This integration guarantees that inclusion is not a side project but rather a key engine of corporate growth. Each new individual brought into the digital economy represents a possible new consumer and a stronger global financial infrastructure.
| Mastercard Pillar | Strategic Focus | Metrics of Impact |
| Insights | Research and evidence-based solutions. | Number of peer-reviewed studies; global data scenario modeling. |
| Impact | Turning evidence into scalable programs. | 1 billion people brought into the digital economy; 65 million SMBs connected. |
| Influence | Fortifying trust in the digital economy. | Multistakeholder partnerships: policy advocacy for financial health. |
Mastercard’s shift to a data- and AI-driven economy is indicative of a forward-thinking perspective. In this case, technology is employed to drive innovation toward quantifiable enhancements in financial well-being rather than escalating inequality. Their objective is to convert static reports into dynamic learning experiences. Also, they disseminate their methods so that outside researchers can duplicate and expand upon their findings.
Case Study 2: The Development of Systemic Reporting with Microsoft
From emphasizing donation totals to systemic change, Microsoft’s CSR reporting has undergone a substantial transformation. Microsoft highlights in its impact summaries that they have earned permission to innovate by consistently achieving long-term goals related to waste, water, carbon, and community ecosystems.
A wide range of topics, including AI Impact, Digital Skills, and Natural Resources, are covered in Microsoft’s extensive reports. Even more, they report on the systemic enabling that those tools bring rather than just the billions of dollars in donated technology. For example, its community training platform has produced 9.7 million finished courses and 16 million registered learners. They are now tracking precise, audited outcomes in their environmental activities, such as a 30% overachievement of land protection targets and the replenishment of 100 million cubic meters of water.
However, Microsoft’s journey began with simpler measures, according to historical context. In 2019, they said that 6.5 trillion security signals were evaluated every day and that 26 million users were connected to GDPR compliance solutions. Nonetheless, the current reporting cycle incorporates these data points into a more comprehensive Reports Hub. This contains specialized disclosures like the Responsible AI Transparency Report and the Environmental Sustainability Report, guaranteeing that every department within the company is accountable to a single goal.
Case Study 3: The Outcome Management Revolution with Salesforce
Also, Salesforce’s integration of Outcome Management into its software infrastructure has completely transformed impact reporting for foundations. Released in late 2023, this innovative feature enables organizations to go beyond snapshots of participation statistics toward the accurate assessment of program outcomes. To begin with, the Salesforce approach uses Outcome Activities to link outcomes to specific activities. Likewise, indicators are used to measure them in order to map the impact strategy.
In order to determine the required inputs and activities, this method compels organizations to work backwards from their desired outcomes, such as increasing academic performance or decreasing childhood hunger. By monitoring Indicator Performance Periods, foundations can establish time-bound goals and baseline values. This makes it easy to track development and assess program efficiency over time.
| Logic Model Category | Salesforce Outcome Management Representation |
| Inputs | Tracked as external data (budgets, staff time). |
| Activities | “Outcome Activities” connecting programs to outcomes. |
| Outputs | “Indicator Definitions” linked to program performance. |
| Outcomes | “Outcome Records” representing strategic changes for stakeholders. |
| Impact | Sustainable, long-term change tracked outside the immediate app. |
This technological shift highlights a crucial lesson for foundations: data collection is only valuable if it can be decoded into meaningful outcomes. Furthermore, Salesforce’s tool compels organizations to ask the “So what?” question. This reminds them that knowing someone attended a workshop (output) provides limited insight compared to knowing they achieved a long-term goal (outcome).
Case Study 4: JPMorgan Chase and the Strategic Retreat to Economic Viability
Lastly, the recent strategic shift by JPMorgan Chase (JPMC) provides an alternative perspective on the pitfalls of “percent-bound” vanity metrics. In its 2024 Sustainability Report, the bank announced it would withdraw its 2030 commitment to reduce operational emissions by 40%. Instead, it moved toward evaluating projects based on their potential impact relative to cost.
While some observers saw this as a retreat from climate goals, JPMC contended that moving away from time- and percent-bound targets allows for a more practical response to a shifting economic and technological context. The bank only reduced its baseline by 14% by the end of 2024, suggesting that the initial 2030 aim may have been an aspirational vanity metric that was no longer supported by practical realities.
Without a doubt, this action highlights a developing trend in the financial industry: giving economic analysis precedence over short-term deadlines. In line with this, JPMC’s foundation strategy has shifted to support financial health through stability, resilience, and wealth creation for marginalized communities. This approach is based on lessons learned from charitable pledges, which emphasize that human-centered design paired with technology generates impact at scale.
VI
Standardized Frameworks: A Comparison of International Standards
For foundations looking to abandon specific vanity metrics, a number of international frameworks offer standardized techniques for assessing and reporting impact. However, the most popular framework is still the Global Reporting Initiative (GRI)

a. Global Reporting Initiative (GRI)
GRI serves as the skeleton for impact reporting. Companies must prioritize the environmental and social concerns that are most important to stakeholders by conducting a materiality analysis. Despite GRI’s institutionalization among big businesses, some contend that it can be viewed as a box-ticking exercise with no context-based goal and does not always result in sustainable impacts in the real world.
b. Business for Social Impact (B4SI)
The B4SI Framework was created especially for measuring contributions to society. It provides a uniform, international standard that converts technical ideas into data that is pertinent to business. When compared to the FTSE 100 averages, companies that adhere to the B4SI Framework report far higher levels of donating and impact results. This demonstrates that organized, outcome-focused measurement increases both social and commercial value.
c. Social Return on Investment (SROI)
SROI is a technique that allows for a double bottom line comparison by assigning monetary values to social, environmental, and economic results. It works especially well for demonstrating the worth of initiatives whose outcomes are difficult to quantify in monetary terms. For instance, truancy reduction ($150) and enhanced school achievement ($2,129) can be given monetary values in order to assess a juvenile crime reduction program.
Conclusion
For corporate foundations, shifting from vanity metrics is now essential to long-term survival in a responsible global marketplace. Foundations must transition from counting activities to managing results. Furthermore, foundations that have already mastered the art of actionable, outcome-based assessment will be in a unique position to propel both business excellence and societal advancement. This is especially crucial as the corporate world moves into an era of required, audited sustainability reporting. The way to a sustainable future is to shift from vanity to value, where corporate foundations are engines of real, quantifiable impact rather than cost centers.

One Response