How to Balance Mission Impact and Accounting Rate of Return
Cersai Stark
I
Introduction
Since the year 2000, accumulated wealth of almost $600 trillion has surpassed global Gross Domestic Product, creating a severe structural imbalance in the global economy. With every dollar of actual investment producing two dollars of debt, this disparity is mostly caused by financial asset appreciation that is not entirely supported by underlying economic or productive growth.
Accounting Rate of Return
Now more than ever, business executives and corporate directors face a dual challenge at the microeconomic level due to this macroeconomic volatility. They must carefully manage operational efficiency and financial returns while responding to calls to incorporate social, environmental, and human capital dimensions into their core strategies. This operational reality reveals itself as a constant struggle to strike a balance between mission impact and conventional capital allocation measures for benefit corporations, social enterprises, and hybrid organizations.
In the past, spending on labour, environmental, and community projects has been viewed by traditional investment appraisal models as operating costs that reduce profitability. However, a well-rounded approach that combines sophisticated social accounting frameworks with strict financial metrics like the Accounting Rate of Return (ARR) can preserve mission integrity while enhancing long-term financial performance.
II
Critical Statistics on Accounting Tool Adoption
In this section, we will consider critical statistics on accounting tool adoption across organizations and the impact.
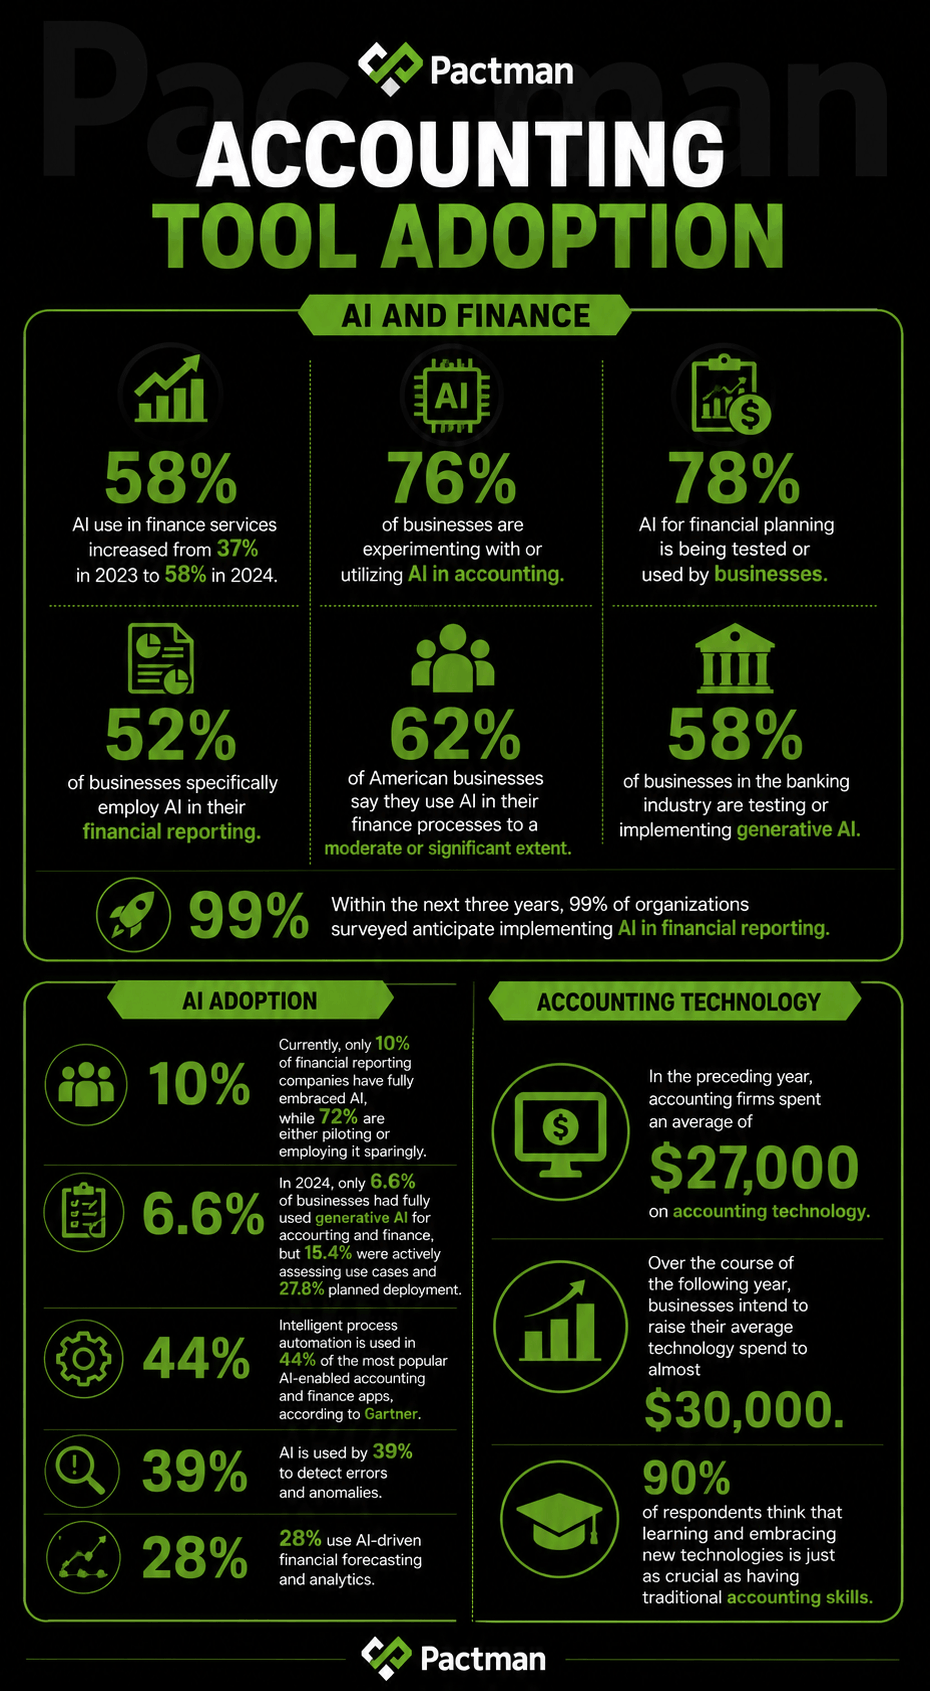
1. AI and Finance
AI use in finance services increased from 37% in 2023 to 58% in 2024. Also, 76% of businesses are experimenting with or utilizing AI in accounting. AI for financial planning is being tested or used by 78% of businesses.
Accounting Rate of Return
52% of businesses specifically employ AI in their financial reporting. Likewise, 62% of American businesses say they use AI in their finance processes to a moderate or significant extent.
In the banking industry, 58% of businesses are testing or implementing generative AI. Within the next three years, 99% of organizations surveyed anticipate implementing AI in financial reporting.
2. AI Adoption
Currently, only 10% of financial reporting companies have fully embraced AI, while 72% are either piloting or employing it sparingly. In 2024, only 6.6% of businesses had fully used generative AI for accounting and finance, but 15.4% were actively assessing use cases and 27.8% planned deployment. Intelligent process automation is used in 44% of the most popular AI-enabled accounting and finance apps, according to Gartner. Also, AI is used by 39% to detect errors and anomalies. 28% use AI-driven financial forecasting and analytics.
3. Accounting technology
In the preceding year, accounting firms spent an average of $27,000 on accounting technology. Over the course of the following year, businesses intend to raise their average technology spend to almost $30,000. Also, 90% of respondents think that learning and embracing new technologies is just as crucial as having traditional accounting skills.
III
Restrictions of Accounting Rate of Return in Social Enterprises
ARR has structural constraints even if it offers an understandable percentage return that corresponds with corporate financial reports. First, it treats a dollar of net profit earned in the tenth year of a project as being worth the same as a dollar earned in the current year, ignoring the time value of money. Second, the average investment book value can be changed without affecting real cash flows due to its high sensitivity to accounting standards like depreciation schedules.
Accounting Rate of Return
Above all, ARR functions within a limited budgetary scope. It is oblivious to the externalities that an investment produces, both favourable and unfavourable returns. An investment in carbon-neutral equipment or local, fair-wage labour raises the initial capital costs or yearly operational expenses of a social firm. These costs lower the average yearly net profit (ARR) on a typical business balance sheet.
Pure ARR models may therefore discourage socially conscious investments when making capital allocation decisions. They don’t account for how these decisions reduce operational risk, boost employee retention, or enhance brand equity—all of which directly contribute to the organization’s long-term survival.
IV
Social Return on Investment for Blended Value Quantification
Organizations leverage the idea of “Blended Value” to represent the broader effects of corporate operations. According to this concept, every firm should produce a single, integrated value proposition that includes social, environmental, and economic benefits. Social Return on Investment (SROI) is a principles-based social accounting approach that uses cost-benefit analysis to capture environmental and social impacts in financial terms. Also, it is used by analysts to quantify this integrated return.
Accounting Rate of Return
The Flow Continuum and SROI Methodology
Compared to conventional impact assessments, SROI is more comprehensive. Essentially, it monetizes results by utilizing financial proxies to express social benefits in a single unit of currency. On the other hand, typical impact assessments largely concentrate on qualitative change. The framework is based on an organized, stakeholder-driven methodology and runs along a continuous operational flow (the “Flow Continuum”).
The SROI Continuum Flow
From original capital to the final production of monetized blended value, this continuum charts the development of an investment:
Continuum Stage
Core Definition
Corporate Action Example (e.g., Fair-Wage Employment)
1. Inputs
The financial, human, and physical resources invested in the initiative.
$100,000 initial capital and 200 hours of management setup time.
2. Activities
The operational processes, services, or programs executed using the inputs.
Structuring and running job-training workshops and career mentorship.
3. Outputs
The direct, tangible, and easily quantifiable products of the activities.
50 historically underemployed community members fully trained.
4. Outcomes
The short-term or long-term changes actually experienced by the stakeholders.
40 participants obtain stable, fair-wage jobs and increase household income.
5. Impacts
The observed outcomes adjusted for what would have happened anyway (the counterfactual).
The net gain in employment rate after subtracting standard local employment trends.
6. Value / SROI
The total monetized social benefit compared against the value of the initial input.
An SROI ratio indicating that $3.50 of social value was generated for every $1 invested.
The SROI Methodology in Six Stages
Organizations use a standardized six-step approach to map, measure, and compute the social value created to perform an SROI assessment. SROI does this by converting non-market results into monetary terms. In addition to normal capital budgeting indicators, this enables organzsations to compute a discounted benefit-to-cost ratio.
Stage
Key Process Steps
Operational Applied Focus
Stage 1
Establish scope and identify key stakeholders.
Define boundaries of the assessment and list affected groups.
Stage 2
Map outcomes.
Develop an impact map connecting inputs and activities to actual changes.
Stage 3
Evidence outcomes and value them.
Collect data on changes and apply financial proxies to non-market outcomes.
Stage 4
Establish impact.
Apply the four adjustments (deadweight, attribution, displacement, drop-off).
Stage 5
Calculate the SROI.
Sum the present value of benefits, subtract negatives, and compute the ratio.
Stage 6
Report, use, and embed.
Share
V
Calculating SROI Framework in Four Stages
To systematically compute these blended returns, organizations use a four-step procedure:
Determine Enterprise Value: Using conventional accounting measurements like net income, cash flow, and financial Return on Investment (ROI), this step evaluates the operational entity’s direct financial performance.
Calculate Social Purpose Value: To monetize beneficial social changes, analysts identify pertinent stakeholders, decide on desired outcomes, and set up financial proxies. It includes modifications to prevent overclaiming, alternative attribution, deadweight (what would have happened otherwise), and displacement of other social activities.
Compute Blended Value: This stage combines the monetized social purpose value with the financial enterprise value. The organization can evaluate its overall economic, social, and environmental contribution in unified monetary terms by merging these metrics.
Determine the Enterprise Index of Return: Lastly, the blended value is compared to the initial capital inputs. This results in a thorough index of return that enables managers and corporate boards to evaluate the effectiveness of their capital allocation both socially and financially.
VI
SROI Applications and Models
Also, SROI can be used both prospectively to predict the social impact of planned investments and retrospectively as an evaluation tool. Three main SROI models have been created over time to address various organizational needs:
SROI Model
Pioneer/Developer
Core Analytical Focus
Typical Organizational Target
REDF Model
Roberts Enterprise Development Fund (2000)
Direct, demonstrable cost savings to public systems and municipal budgets, alongside wage generation.
Social enterprises focused on employment integration and reducing public dependency.
NEF Model
New Economics Foundation
Holistic, stakeholder-driven valuation, incorporating broader public, health, and community benefits.
Public sector agencies, philanthropic grant-makers, and corporate CSR programs.
SCP Model
Social Capital Partners
Simplified metrics using a Sustainable Livelihoods Framework to track employment outcomes.
Private social enterprises and impact investors seeking streamlined evaluations.
It is possible to modify these quantitative measurements for specific problems. For example, Participatory SROI (PSROI) evaluates community development and climate change adaptation initiatives. This is achieved by combining critical systems thinking, resilience theory, participatory action research, and cost-benefit analysis.
Despite its advantages, SROI requires a lot of resources. Choosing financial proxies adds a subjective element, and gathering trustworthy stakeholder data takes a significant amount of time and money. It is still challenging to establish a clear causal relationship between a corporate investment and ensuing social developments. Therefore, to provide appropriate context, SROI data should always be offered with qualitative stories.
Conclusion
The long-standing distinction between pursuing a social mission and optimizing financial gain is quickly eroding. Strictly relying on conventional financial measures like the Accounting Rate of Return (ARR) is no longer adequate in a time of unstable macroeconomic trends and elevated public expectations.
Although ARR is still a useful tool for monitoring short-term accounting gains, organizations are exposed to hidden liabilities due to its structural blindness to social and environmental externalities, such as staff attrition and regulatory actions. On the other hand, pursuing a public objective without strict financial supervision is just as untenable. The ones who possess true organizational resilience are the “People + Performance Winners.” These are organizations that approach organizational health and human capital development with the same structural rigour they apply to margin and cash flow.
In the current nonprofit environment, organizations are increasingly relying on technology to enhance donor interaction, ensure compliance, and streamline operations. The Pactman Nonprofit CheckPlus API […]
TABLE OF CONTENTS Introduction Overview of Nonprofit Grant Options Critical Statistics on Nonprofit Grants in the U.S. Nonprofit Grants in Washington Nonprofit Grants in Alabama […]
TABLE OF CONTENTS Introduction Nonprofit Funding Gaps in Africa Critical Statistics on Nonprofit Grants Local vs International Nonprofit Grants in Africa: A Comparative Analysis Overview […]
As a climate change leader, Virginia establishes its position by implementing forward-thinking policy measures through renewable power investments and nature protection initiatives. The government of […]
The state of Illinois stands out as a climate change leader through its dedicated green legislation, its allocation of renewable energy financing and its distinctive […]