


I
Introduction
Compound Annual Growth Rate (CAGR) has a very different use in nonprofit financial analysis than it does in corporate finance. CAGR is mostly used in the business sector as a technique for comparing investments. It’s used to gauge capital growth and the creation of shareholder wealth over time. On the other hand, in the context of exempt organizations, CAGR is a crucial indicator of institutional sustainability, long-term capital preservation, funding trajectory stability, and programming scale.
Simple year-over-year percentage increases can show highly misleading patterns since philanthropic revenue models are extremely vulnerable to macroeconomic instability, legislative changes, and altering donor opinion.
II
Critical Statistics on Compound Annual Growth Rate
In this section, we will consider crucial statistics on Compound Annual Growth Rate across organizations.
a. Nonprofit market
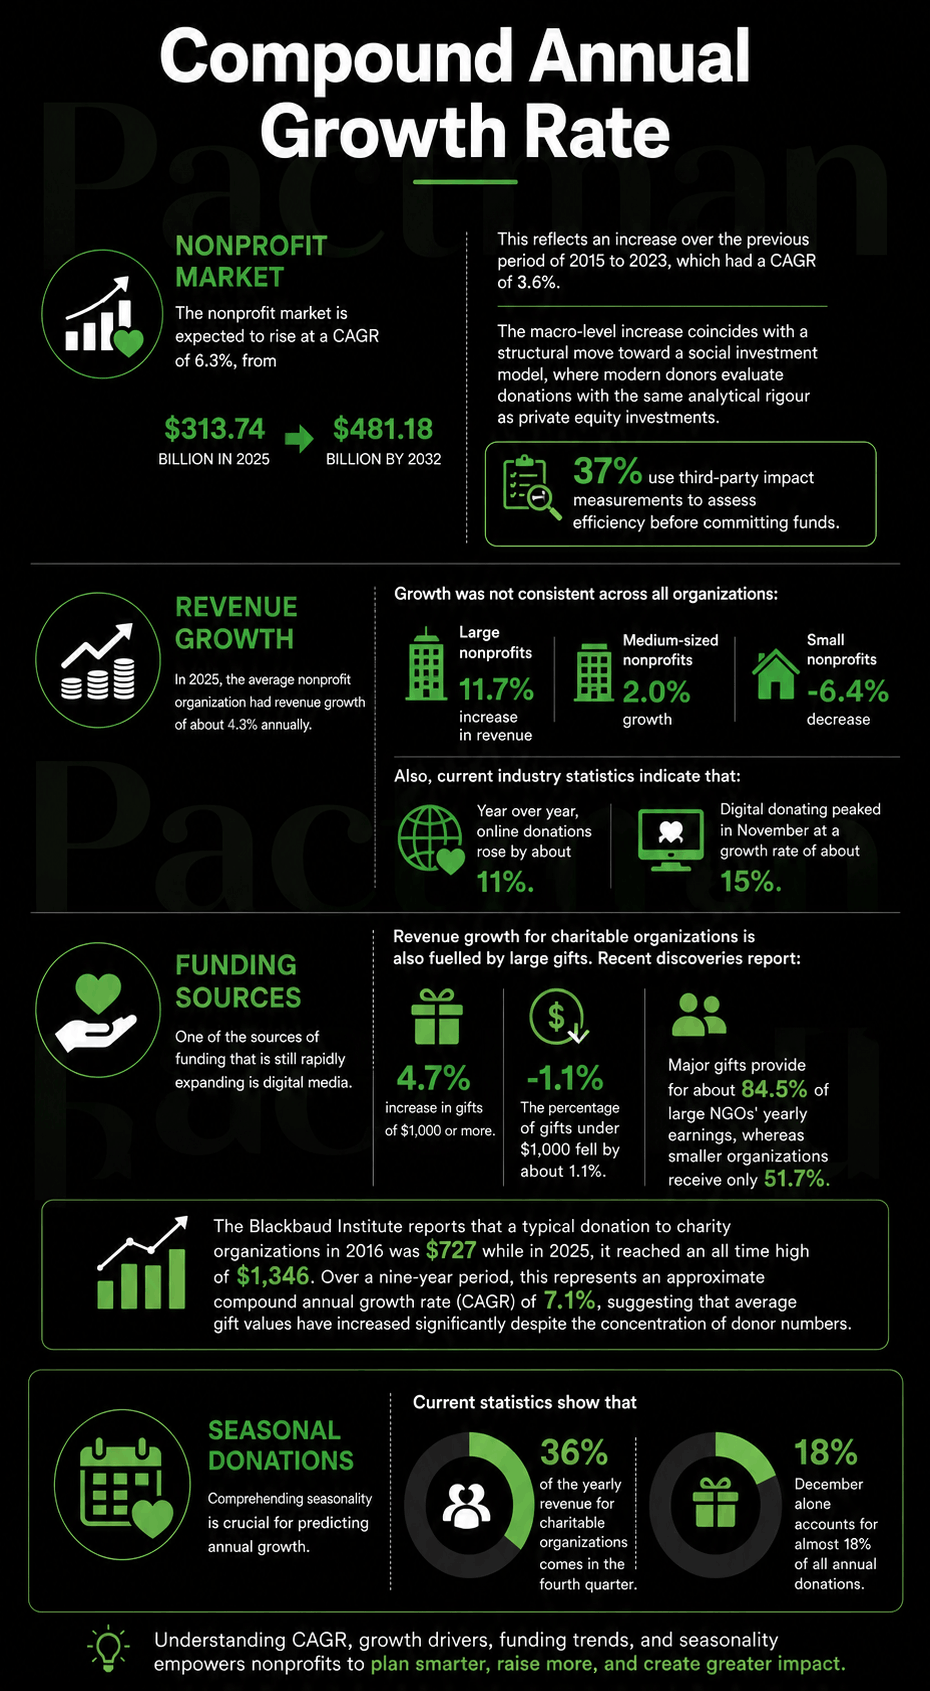
The nonprofit market is expected to rise at a compound annual growth rate (CAGR) of 6.3%, from $313.74 billion in 2025 to $481.18 billion by 2032. This reflects an increase over the previous period of 2015 to 2023, which had a CAGR of 3.6%. Also, the macro-level increase coincides with a structural move toward a social investment model, where modern donors evaluate donations with the same analytical rigour as private equity investments.
37% use third-party impact measurements to assess efficiency before committing funds.
b. Revenue growth
In 2025, the average nonprofit organization had revenue growth of about 4.3% annually.
Growth was not consistent across all organizations:
- Large nonprofits: 11.7% increase in revenue
- Medium-sized nonprofits: 2.0% growth
- Small nonprofits: -6.4% decrease.
Also, current industry statistics indicate that:
- Year over year, online donations rose by about 11%.
- Digital donating peaked in November at a growth rate of about 15%.
c. Funding sources
One of the sources of funding that is still rapidly expanding is digital media.
Revenue growth for charitable organizations is also fuelled by large gifts.
Recent discoveries report:
- a 4.7% increase in gifts of $1,000 or more.
- The percentage of gifts under $1,000 fell by about 1.1%.
- Major gifts provide for about 84.5% of large NGOs’ yearly earnings, whereas smaller organizations receive only 51.7%.
The Blackbaud Institute reports that a typical donation to charity organizations in 2016 was $727, while in 2025, it reached an all-time high of $1,346. Over nine years, this represents an approximate compound annual growth rate (CAGR) of 7.1%, suggesting that average gift values have increased significantly despite the concentration of donor numbers.
d. Seasonal donations
Comprehending seasonality is crucial for predicting annual growth. Current statistics show that the fourth quarter generates about 36% of the yearly revenue for charitable organizations. December alone accounts for almost 18% of all annual donations.
III
Micro-Level CAGR Diagnostics: Examining IRS Form 990 and Schedule D Filing Methods and Data Access
IRS Form 990 is the principal source of financial disclosure for nonprofit organizations in the United States. Organizations with gross receipts over $200,000 are required by federal tax regulations to file the complete Form 990. Also, smaller organizations are required to file Form 990-EZ or 990-N. Gross receipts are different from total revenues since they include money collected from all sources without deducting any expenses.

In the past, it was quite time-consuming to extract this data. But since 2016, Forms 990 have been electronically filed on Amazon Web Services (AWS) in a machine-readable XML format. This has significantly decreased research friction and allowed for automated, high-fidelity longitudinal benchmarking over millions of forms.
1. Donor Kinetics and Dynamics of Retention
Analysts must examine donor dynamics to determine whether an organization’s funding model is structurally stable. This demands a dual-track computation of the trailing CAGR for the total donation value as well as the number of donors: If the Donation Value CAGR is extremely positive (e.g., 9%) but the Donor Count CAGR is negative (e.g., -4%), the organization’s average contribution size is increasing while its financing risk is concentrated in a smaller group of major donors. Consequently, this concentration risk can seriously jeopardize the nonprofit’s financial health if a big donor or foundation leaves. By and large, this emphasizes the importance of tracking donor retention measures alongside top-line growth.
2. Preserving Endowment Capital and Spending Patterns
Schedule D on Form 990 is the principal diagnostic tool for organizations with long-term endowments. Part V of Schedule D requires a rolling five-year disclosure of endowment activity. This includes beginning balances, contributions, net investment earnings, grants issued, administration expenses, and ending balances. Likewise, organizations are required by FASB ASC 958 rules to distinguish between board-designated (quasi) endowments and donor-restricted endowments (both permanent and term), and to disclose the percentages retained in each category.
To assess capital preservation, an endowment’s capital base’s trailing five-year CAGR must be calculated. A tight preservation equilibrium must be met by the endowment’s investment return CAGR in order to preserve its real, inflation-adjusted purchasing power.
For instance, systemic empirical analysis of 35,755 nonprofit endowments in the United States between 2009 and 2018 shows that many institutional portfolios have traditionally underperformed benchmarks from the market.
During this time, endowments had a median yearly investment return of about 2.57%, which was around 4.20 percentage points lower than a typical 60-40 mix of equities and Treasury bond indices. Future fundraising will be directly impacted by this underperformance, as donor contributions show an elasticity of about 0.20 in relation to net-of-market endowment returns. This means that higher subsequent donations are actively driven by stronger investment return CAGRs.
IV
Overhead Myth and the 80/20 Rule
The overhead myth erroneously holds that an organization’s efficiency can be ascertained by comparing its direct program costs to its overhead expenses. This was made popular for decades by charity watchdogs and contributors. The “80/20 rule” holds that a healthy charity must devote at least 80% of its total expenses directly to programming, leaving 20% or less for administrative and fundraising overhead. This became widely accepted as the benchmark for nonprofit efficiency.

However, the strict ratio has been challenged by prominent research organizations and expert evaluators. A campaign to dispel the overhead myth was launched in 2013 by GuideStar (Candid), Charity Navigator, and the BBB Wise Giving Alliance. The campaign explained that a charity’s ability to provide safe, effective programming is compromised by underinvesting in infrastructure.
For example, an animal shelter’s overhead costs include facility rent, utilities, staff pay, and the technology needed to track adoptions; its direct program costs include pet food and medical supplies. By limiting overhead expenditures to an artificial 80/20 ratio, the shelter’s goal is undermined because it is unable to hire experienced veterinarians, buy secure database software, or maintain a secure location.
The “nonprofit starvation cycle” occurs when an organization gives in to pressure from donors to reduce expenses. Donors’ demands for low overhead cause organizations to underreport administrative costs and underinvest in their infrastructure. This creates a risky feedback loop that drives the cycle. Also, underreporting deprives the organization of the funds needed for viability by sustaining irrational donor expectations.
Consequences
There is ample evidence of the dire repercussions of this underfunding of fundamental systems:
- Staff Burnout and Turnover: Persistently low administrative budgets result in low compensation, subpar benefits, and little opportunity for professional growth, all of which exacerbate employee burnout. Due to inadequate assistance and low pay, more than 60% of nonprofit workers say they frequently suffer difficult workloads, and 67% say they are actively seeking new employment or want to do so within a year.
- Weak IT and Security Risks: Also, organizations that suppress administrative technology spending run the risk of experiencing system failures, outmoded IT infrastructure, and catastrophic loss of donor and beneficiary data.
- Ineffective Program Tracking: When organizations underinvest in internal systems, they are unable to maintain appropriate financial controls, track long-term beneficiary results, and produce compliance reports for grantmakers.
All in all, analysts must assess the CAGR of both program and overhead expenses in order to end this cycle. A healthy, growing nonprofit should have a balanced CAGR in all categories. This proves that the organization is making the staff and infrastructure investments required to support programmatic growth.
V
Communication Strategy and the Minto Pyramid Theory
When presenting multi-year financial trends to volunteer board members, nonprofit CFOs and finance directors must convert complex fund accounting data into understandable, useful insights. Board trustees are prone to cognitive strain when faced with complex tables of figures since they frequently lack time and may not have received proper training in public charity reporting.

Also, financial executives should use the top-down executive communication paradigm created by McKinsey & Company. This is known as the Minto Pyramid Principle, to overcome communication barriers.
The Pyramid Principle’s Structure
“You think from the bottom up, but you present from the top down” is the fundamental tenet of the Pyramid Principle. The presenter must reverse the order and begin with the final recommendation or finding (the executive’s deductive communication process) rather than walking the board through the entire chronological analysis and building to a conclusion at the end (the analyst’s natural, inductive thinking process).
There are three separate layers to this top-down communication:
- The Governing Assertion, sometimes known as “The Answer,” is a single, precise, and practical statement that addresses the central strategic question. A maximum of three mutually exclusive, collectively exhaustive (MECE) arguments that demonstrate the validity of the governing proposition are known as supporting arguments (MECE).
- Data and Evidence: The precise financial measurements, charts, and tables that back up each claim.
- Executive Briefing Structure, Slide by Slide
Also, the CFO should organize the deck along a succinct 6-slide flow for a board-level presentation of a multi-year financial assessment, using declarative “Action Titles” that highlight each slide’s key point rather than nonspecific subjects:
Sample Deck
| Slide Number | Slide Title Type | Core Narrative Focus | Supporting Financial Data Inputs |
| Slide 1 | The Answer (Assertion) | State the core strategic finding and recommendation immediately in one sentence. | “Our trailing five-year revenue CAGR of 8.2% outpaced expense growth, enabling us to safely expand program services in Q3.” |
| Slide 2 | Supporting Point 1 | First and strongest argument: explain the stability of core revenue streams. | Historical CAGR breakdown of Line 1 contributions vs. Line 2 program service fees, illustrating a diversified funding model. |
| Slide 3 | Supporting Point 2 | Second argument: demonstrate healthy reserve levels and liquidity cushion. | Trend analysis of Months of Cash on Hand and the Operating Reserve Ratio over the compounding period. |
| Slide 4 | Supporting Point 3 | Third argument: show that infrastructure investments are keeping pace with program growth. | CAGR comparison of Part IX functional expenses, proving that administrative scaling has successfully prevented staff burnout. |
| Slide 5 | Implications | Outline potential future risks, market dependencies, and forecasting assumptions. | Pro forma modeling of unrestricted cash balances under best-, moderate-, and worst-case funding environments. |
| Slide 6 | Next Steps | Present one clear, actionable ask to the board, such as approving the Q3 program expansion. | Specific budget allocation requests and timeline milestones linked to the strategic plan. |
By using this standard, the CFO guarantees that an executive board member can completely understand the financial rationale and strategic direction by merely reading the action titles on each slide, even if they only have five minutes to peruse the deck.
Conclusion
When analyzing the CAGR in financial reports, nonprofit boards, CFOs, and consultants must strike a balance between quantitative accuracy and a thorough comprehension of tax-exempt laws, organizational size, and the reality of the nonprofit hunger cycle.