


I
Introduction
For any nonprofit, maintaining financial health is the cornerstone of long-term mission delivery and not an objective apart from it. A strong financial foundation guarantees that the nonprofit can withstand unforeseen challenges and make calculated investments in its continued efficiency.

Essentially, three interconnected pillars—Liquidity, Stability (or Solvency), and Efficiency—are the main focus of analysts’ assessments of financial health. Liquidity is the ability to promptly pay short-term operational costs and financial commitments. Stability is the ability to continue operations and expand strategically over the long term. Lastly, efficiency gauges how well resources are allocated, guaranteeing that the greatest possible amount of funds is used to fulfil the mission’s purpose.
Also, similar to for-profit organisations, nonprofits use Key Performance Indicators (KPIs) and quantitative metrics to evaluate performance and make data-driven choices. Financial ratios offer a rapid and reliable way to gauge an organisation’s strength and spot long-term rising or downward trends.
Furthermore, measuring risk exposure and organisational durability is at the heart of financial evaluation, which is a crucial factor in the nonprofit sector.
Organisations are naturally less robust when they are unable to make the required capital investments or accumulate vital financial reserves. Typical sector problems, like unforeseen funding variations or economic volatility, become real threats to existence due to this lack of organisational durability.
Likewise, cautious interpretation is frequently needed to determine the true measure of sustainability. Sustainability may be seen by some donors or grantmaking organisations as less dependence on outside funding sources. However, for many NGOs, sustainability simply means having enough steady capital to run and expand efficiently, regardless of the exact source framework. Rather than demanding complete independence, an effective evaluation should prioritise attaining diverse dependency.
In this article, we will consider effective ways to evaluate nonprofit financial health.
II
Critical Statistics on Financial Health for Nonprofits
In this section, we will consider critical trends in financial health in the nonprofit sector.
a. Risk indicators
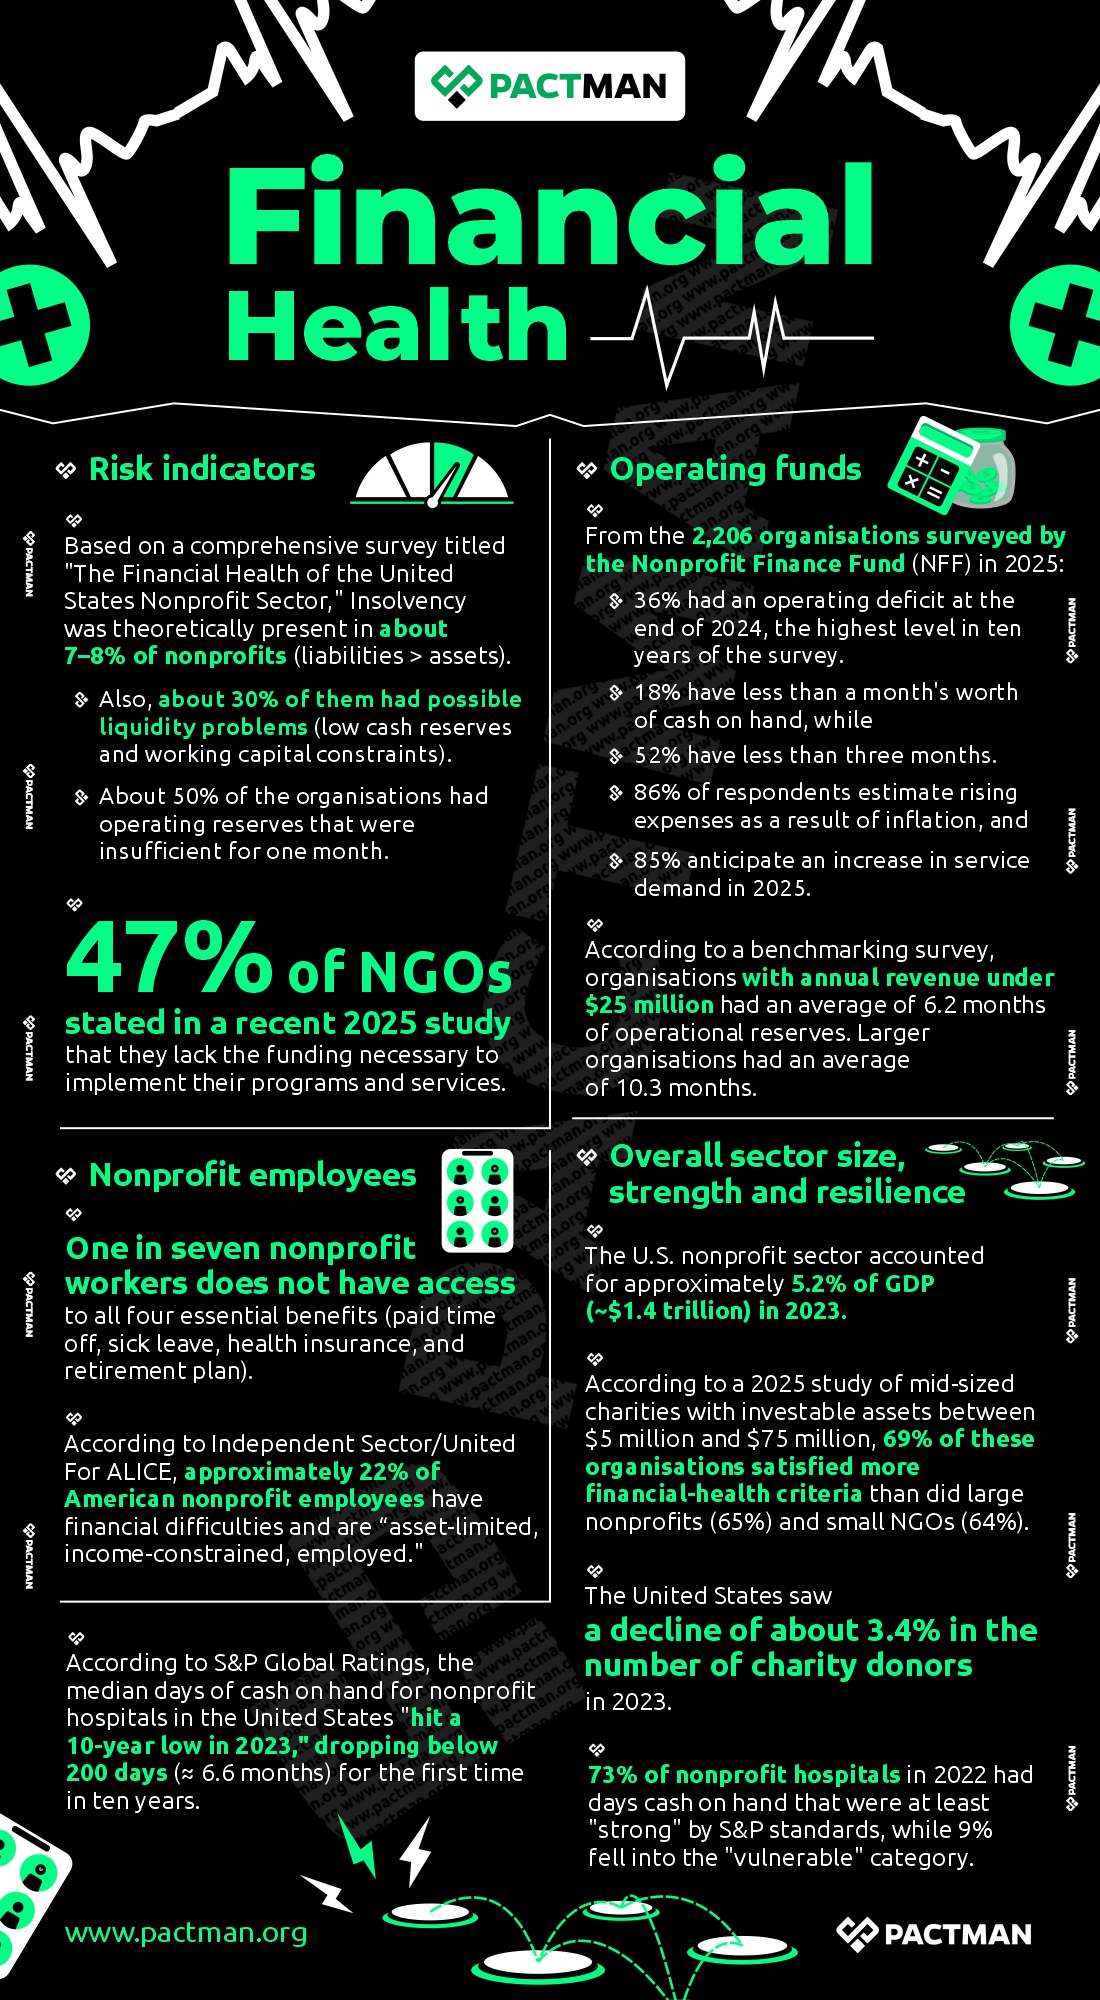
Based on a comprehensive survey titled “The Financial Health of the United States Nonprofit Sector,” Insolvency was theoretically present in about 7–8% of nonprofits (liabilities > assets).
- Also, about 30% of them had possible liquidity problems (low cash reserves and working capital constraints).
- About 50% of the organisations had operating reserves that were insufficient for one month.
47% of NGOs stated in a recent 2025 study that they lack the funding necessary to implement their programs and services.
b. Operating funds
From the 2,206 organisations surveyed by the Nonprofit Finance Fund (NFF) in 2025:
- 36% had an operating deficit at the end of 2024, the highest level in ten years of the survey.
- 18% have less than a month’s worth of cash on hand, while
- 52% have less than three months.
- 86% of respondents estimate rising expenses as a result of inflation, and
- 85% anticipate an increase in service demand in 2025.
Furthermore, according to a benchmarking survey, organisations with annual revenue under $25 million had an average of 6.2 months of operational reserves. Also, larger organisations had an average of 10.3 months.
c. Nonprofit employees
One in seven nonprofit workers does not have access to all four essential benefits (paid time off, sick leave, health insurance, and retirement plan). According to Independent Sector/United For ALICE, approximately 22% of American nonprofit employees have financial difficulties and are “asset-limited, income-constrained, employed.”
d. Overall sector size, strength, and resilience
The U.S. nonprofit sector accounted for approximately 5.2% of GDP (~$1.4 trillion) in 2023. Also, according to a 2025 study of mid-sized charities with investable assets between $5 million and $75 million, 69% of these organisations satisfied more financial-health criteria than did large nonprofits (65%) and small NGOs (64%). The United States saw a decline of about 3.4% in the number of charity donors in 2023.
According to S&P Global Ratings, the median days of cash on hand for nonprofit hospitals in the United States “hit a 10-year low in 2023,” dropping below 200 days (≈ 6.6 months) for the first time in ten years. Even more, 73% of nonprofit hospitals in 2022 had days cash on hand that were at least “strong” by S&P standards, while 9% fell into the “vulnerable” category.
III.
Effective Steps in Evaluating Nonprofit Financial Health
In this section, we will outline the critical areas to consider in evaluating the financial health of your nonprofit.

1. Comprehending the Fundamental Financial Statements
To begin with, the underlying source data, which are the organisation’s fundamental financial accounts, must be fully comprehended and trusted before ratios can be computed and examined. Even more, financial ratios are only useful if they are computed consistently throughout time and are based on precise, dependable reports, which are usually produced via an annual audit.
Key Analytical Statements
Three basic assertions that together characterise the nonprofit’s financial realities form the basis of the analysis:
- The Statement of Financial Position (Balance Sheet):
This statement offers a quick overview of the organisation’s financial situation at a certain moment in time. Liabilities (what the organisation owes), assets (what it owns), and net assets (the nonprofit equivalent of equity) are listed. By offering insights into long-term stability and solvency, the main goal of this statement is to ensure the organisation’s eventual ability to fulfil its long-term financial obligations.
- The Income Statement (Statement of Activities):
This document details the organisation’s revenue and expenses for a given time period, like a fiscal year, to report on its financial success. The statement is essential for figuring out different efficiency and margin ratios. All in all, it shows whether the organisation is making more money than it is spending.
- The Statement of Cash Flows:
This report breaks down the actual flow of funds into and out of the organisation according to operating, investing, and financing activities. Also, it is frequently the most transparent representation of an organisation’s short-term financial health.
Table: Core Financial Statements
| Financial Statement | Key Question Answered | Financial Health Focus |
| Statement of Financial Position (Balance Sheet) | What do we own and owe today? | Stability and Solvency |
| Statement of Activities (Income Statement) | Did we earn more than we spent this year? | Performance and Surplus Generation |
| Statement of Cash Flows | Where did the actual cash come from and go? | Liquidity |
2. Quick Resilience Check – Assessing Liquidity Ratios
Liquidity measures the nonprofit’s ability to swiftly and affordably turn assets into cash to cover short-term debts (those due within a year). Working capital, which is calculated as current assets less current liabilities, is a basic metric. Essentially, good short-term financial health is indicated by a positive working capital figure. This shows that the organisation’s readily available assets outweigh its immediate debts.
Key Liquidity Ratios
- Current Ratio (or Working Capital Ratio):
Division of total current assets by total current liabilities yields this complete indicator of short-term health. Also, the outcome gauges the organisation’s overall capacity to meet milestones within a year. A ratio above 1.0 indicates that assets surpass liabilities, which is fine. Nevertheless, strategically managed organisations typically aim for a range of 1.5 to 3.0.
- Quick Ratio (or Acid Test Ratio):
This ratio offers a more stringent evaluation of short-term liquidity. It is computed by taking the total of marketable securities, cash, and accounts receivable and dividing it by current liabilities. Furthermore, the Quick Ratio purposefully leaves out assets like inventory that could take a while to turn into cash.
Since inventory depends on sales cycles to produce cash, its removal guarantees that the Quick Ratio only includes the resources that are most easily accessible to settle short-term obligations. The liquidity trap is a possible operational constraint that can be found by combining the investigation of these two ratios.
When a nonprofit has a high current ratio (e.g., 2.5) but a low quick ratio (e.g., 0.8), it indicates that a considerable amount of its current assets are locked up in forms that are hard to access right away. This includes accounts receivable that take a long time to obtain or prepaid expenses. Even more, the discrepancy suggests that even though the organisation might seem financially stable on paper, unanticipated, urgent spending could put it in serious financial jeopardy.
3. Long-Term Strength (Stability and Sustainability Ratios)
Lastly, stability gauges the organisation’s ability to carry out its goal over the long run. By and large, the strong emphasis is on accumulating reserves, producing a steady surplus, and preserving strong organisational equity (net assets).
Also, strategic action is essentially dependent on Unrestricted Net Assets. Since these funds are not subject to donor constraints, they offer the flexibility required to pay for operating costs, make strategic infrastructure investments, and act as a crucial safety net in times of need or emergencies.
Key Sustainability Ratios
- Operating Reserve Ratio:
The nonprofit’s ability to cover operating costs for several months using its safety net (unrestricted reserves) is measured by this crucial stability statistic. To calculate, divide the total annual expenses (or average monthly expenses) by the unrestricted operating reserves.
According to a commonly accepted standard, nonprofit organisations should stockpile six to twelve months’ worth of operational expenses, or a ratio of 0.5 to 1.0.
- Relative to operating margin:
This ratio assesses whether the nonprofit is making, spending, and saving money with the long term in mind by calculating its potential surplus. The formula is:
(Total Revenue – Total Expenses) divided by Total Revenue.
A negative outcome shows that costs are higher than income. This then necessitates quick fixes like cost reductions or the creation of new financing sources. Building reserves and making smart investments require a ratio that is continuously positive.
- The Savings Indicator Ratio:
This is determined by dividing Total Revenue by Total Expenses. Essentially, it measures the portion of total income that can be set aside for future needs after expenses have been paid.
Conclusion
Before minor problems turn into significant crises, financial ratios must be incorporated into monthly and quarterly financial evaluations. Primarily, the goal is to spot negative patterns and carry out the required action plans, such as increasing revenue or optimising expenses. In the end, nonprofit leaders are required to see finance as the strategic engine of mission execution rather than as a burdensome accounting duty. Long-term resilience, effectiveness, and impact are ensured by regular, consistent, and detailed financial evaluation.

4 Responses