Gross Domestic Product as a Framework for Evaluating Nonprofit Sector Performance
Cersai Stark
I
Introduction
The market value of all finished goods and services generated in the US by labor and property is known as the gross domestic product, or GDP. Usually, three methods are used to calculate the value (output, revenue, and spending), all of which provide the same total. Also, GDP incorporates some nonmarket activity through imputation in order to be complete. GDP, for instance, assigns a rental value to owner-occupied houses or the value of free banking services to ensure that GDP is not only dependent on market prices.
Gross Domestic Product
However, gross domestic product ignores whether economic activity improves or degrades human welfare, fails to account for the avoidance of societal crises, and eliminates unpaid volunteer labor. Hence, this case study highlights the structural shortcomings of GDP as an evaluation scorecard. Afterwards, it offers practical alternatives for corporate executives, philanthropists, and legislators by considering the workings of national accounting and new frameworks.
II
Critical Data on Gross Domestic Product
In this section, we will consider critical data to help us understand the impact and importance of gross domestic product.
1. Global GDP
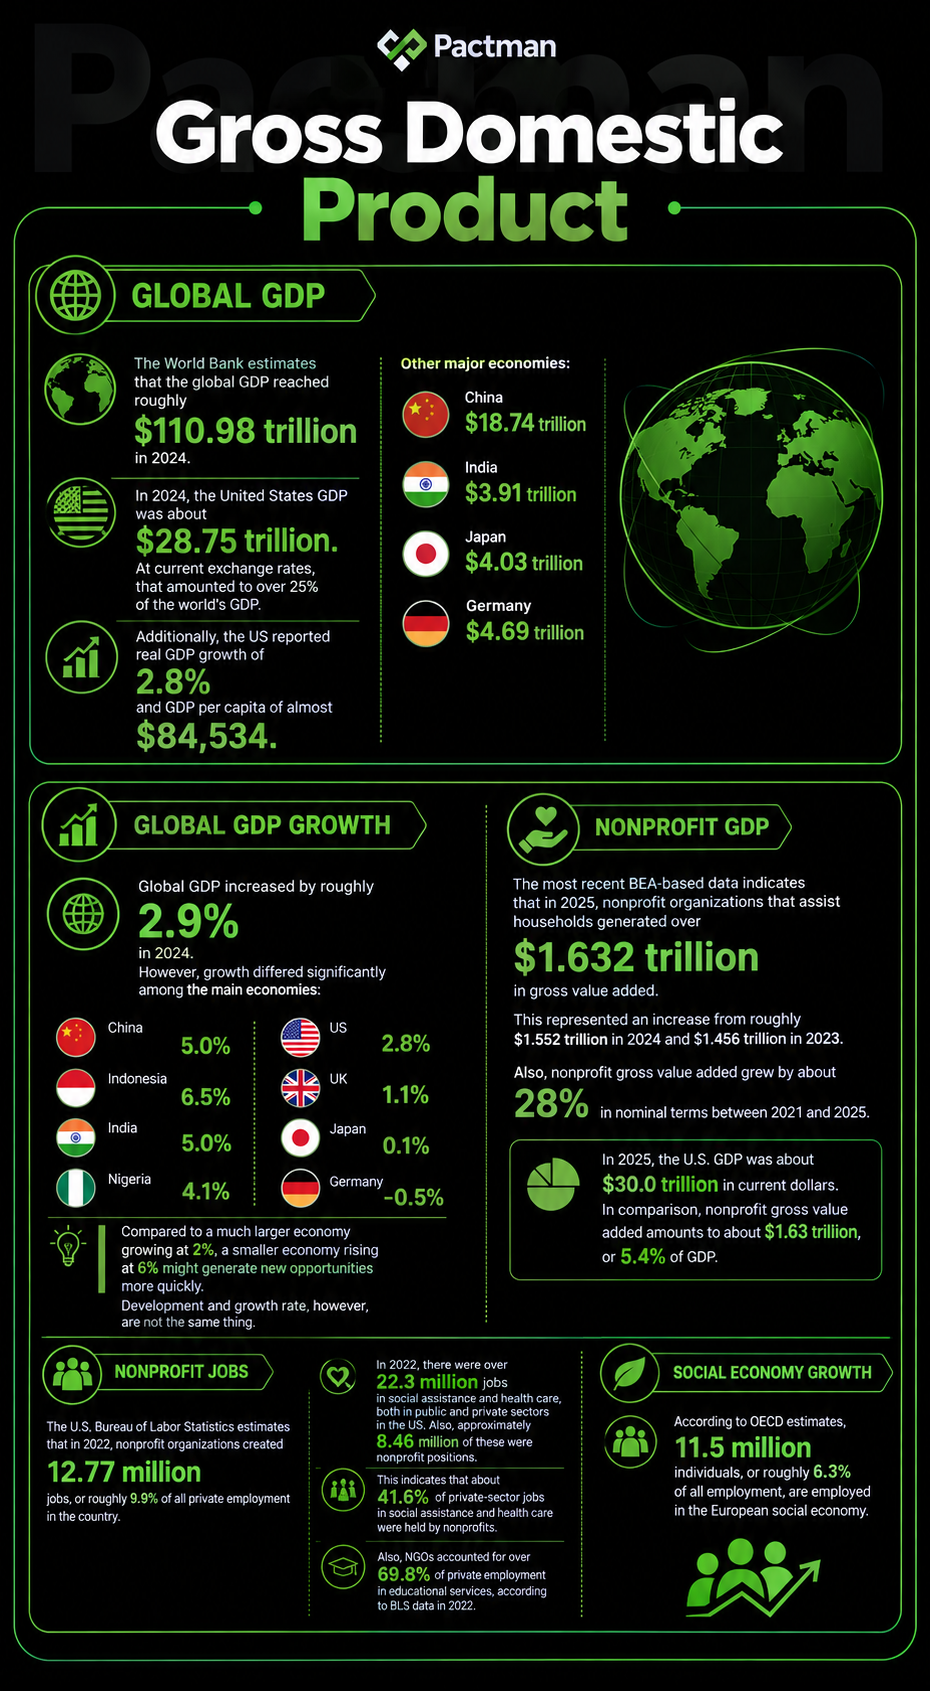
The World Bank estimates that the global GDP reached roughly $110.98 trillion in 2024. Also, in 2024, the United States’ GDP was about $28.75 trillion. At current exchange rates, that amounted to over 25% of the world’s GDP. Additionally, the US reported real GDP growth of 2.8% and GDP per capita of almost $84,534.
gross domestic product
China came next with roughly $18.74 trillion. India recorded over $3.91 trillion, Japan $4.03 trillion, and Germany $4.69 trillion.
Selected economies, 2024
Economy
GDP
GDP per capita
GDP growth
United States
$28.75T
$84,534
2.8%
China
$18.74T
$13,303
5.0%
Germany
$4.69T
$56,104
-0.5%
Japan
$4.03T
$32,487
0.1%
India
$3.91T
$2,695
6.5%
Indonesia
$1.40T
$4,925
5.0%
Nigeria
$252.3B
$1,084
4.1%
NOTE: The table demonstrates a crucial idea: The fastest-growing economy is not always the richest per capita, and the largest economy is not always the fastest-growing economy.
Compared to a much larger economy growing at 2%, a smaller economy rising at 6% might generate new opportunities more quickly. Development and growth rate, however, are not the same thing.
3. Nonprofit GDP
The most recent BEA-based data indicates that in 2025, nonprofit organizations that assist households generated over $1.632 trillion in gross value added. This represented an increase from roughly $1.552 trillion in 2024 and $1.456 trillion in 2023. Also, nonprofit gross value added grew by about 28% in nominal terms between 2021 and 2025.
In 2025, the U.S. GDP was about $30.0 trillion in current dollars. In comparison, nonprofit gross value added amounts to about $1.63 trillion, or 5.4% of GDP.
According to OECD estimates, 11.5 million individuals, or roughly 6.3% of all employment, are employed in the European social economy.
III
Credible Data Sources on the US Nonprofit Sector
There are several sources used to measure NGOs, each having advantages and disadvantages.
Gross Domestic Product
a. BEA National Accounts (NIPA):
BEA’s NIPA tables include NPISH consumption (individual consumption of NPISHs) and aggregate measurements of arts, culture, recreation, health, etc. Although nonprofit industries are not listed separately in the GDP-by-industry calculations, some output from nonprofit-dominated sectors such as healthcare and education is included in more general industry totals.
BEA occasionally estimates nonprofit service production using Census surveys, such as the Quarterly Services Survey. However, there is no specific nonprofit employment or GDP series published by BEA. In summary, BEA offers macro GDP statistics, including NPISH final consumption but minimal sectoral breakdown for NGOs.
b. IRS Form 990 Data (NCCS):
Also, nonprofits with income above $25,000 are required by the IRS to submit Form 990, which details revenue, costs, assets, and activities. IRS Form 990 data is gathered into research datasets by the National Center for Charitable Statistics (NCCS). For instance, according to the NCCS Nonprofit Sector in Brief 2019, there were about 1.54 million organizations in 2016, and the nonprofit sector generated $2.04 trillion in revenue, of which ~¾ came from 501(c)(3) charities.
Additionally, it projects that NGOs contributed $1.047T (5.6% of GDP) in 2016.
However, churches and very small organizations are not included in the NCCS statistics, making it reliable for large nonprofits. IRS/NCCS statistics are yearly (with a delay) and don’t measure GDP directly. Rather, they are charitable organizations’ raw funds that need to be transformed into GDP-style outputs.
c. Bureau of Labor Statistics (BLS):
In the past, BLS’s mainstream reports did not include a distinct nonprofit sector segment. Nonprofits were rolled into sectors such as health or education without being identified by tax status. Nonetheless, experimental series have been developed via BLS research. By merging QCEW and IRS data, BLS published nonprofit employment/wage statistics (2007–2012) in 2014. These include 501(c)(3) public charities, which make up more than two-thirds of organizations.
For instance, they demonstrate how nonprofit employment and incomes increased continuously between 2007 and 2012 while the private sector as a whole decreased. Although they are not included in official GDP accounts, BLS also uses periodic surveys such as the American Time Use Survey and CPS supplements to evaluate volunteerism. BLS Business Employment Dynamics can monitor sector growth, albeit with lags, and the Quarterly Census of Employment and Wages (QCEW) can identify nonprofits by industry (NAICS 813 – churches, social services, etc.).
In conclusion, BLS offers comprehensive employment and salary statistics via surveys or studies, but it does not produce official GDP.
d. NCES (Education Statistics):
The National Center for Education Statistics monitors schools and colleges. For instance, according to NCES, private nonprofit colleges spent $239 billion in 2020–2021. Although NCES does not calculate GDP on its own, its statistics can influence NPISH output, particularly for NGOs that prioritize education. The scale of nonprofit educational outputs is provided by NCES and other education reports. Public K–12 and public colleges are government or mixed. Therefore, they are technically outside private nonprofit NPISH in GDP.
e. Additional sources:
Every five years, NAICS 813 (nonprofit organizations) are included in the Economic Census, which provides information on payroll and revenue. Firm counts are provided by the Census Business Patterns and Annual Survey of Nonprofits (planned by Census/OMB). Also, partial inputs come from voluntary foundation questionnaires and statistics from combined federal and state funds. Since no single source is complete, researchers frequently integrate sources such as IRS, QCEW, surveys, and academic estimates to create a more complete picture.
Without a doubt, these data have significant limitations. There are lags and unreported groups in IRS/NCCS data, such as religious and small organizations. Also, BLS QCEW excludes certain part-time employment and self-employed people, who are frequently found in major charitable organizations, such as clergy and lone professors. Not to mention, the NIPAs of BEA completely exclude volunteers. There are no official U.S. time series that separate NPISH productivity or GDP. To fill in these gaps, Independent Sector and others have pushed for regular BLS statistics on organizations and even a BEA nonprofit satellite account.
IV
Performance Measures in a GDP Framework
A GDP-based perspective allows us to assess nonprofits using productivity and aggregate metrics:
Gross Domestic Product
1. GDP share and growth:
To begin with, the percentage of the country’s output that goes to NGOs is a fundamental metric. Since NPISH solely includes free services, its ultimate consumption has been approximately 2% of GDP. However, when BEA’s “contribution” (compensation + renting) is taken into account, the sector represents approximately 5-6% of GDP. In response, policymakers may monitor changes in this share. For instance, the GDP proportion of nonprofits increased between 1970 and 2007, then remained at 5.5% before momentarily declining in 2020.
In 2022, about 9–10% of private payroll jobs were held by nonprofits. Likewise, a productivity measure (output per worker) can be obtained by tracking nonprofit employment (using BLS or QCEW) and connecting it to sector production. Furthermore, nonprofits typically have lower labor productivity than the ordinary economy (partly due to significant volunteer inputs). In the U.S., one may compute nonprofit labor productivity as:
(NPISH output) / (paid FTEs).
As an alternative, volunteers could be included in the input measure for a more comprehensive social productivity.
3. Sector resilience:
Generally, the performance of the nonprofit sector might reveal risk or resilience when compared to the overall economy. For instance, nonprofit employment and earnings increased between 2007 and 2012 despite a decline in the private sector as a whole. Likewise, policy assistance is informed by tracking such divergences (sector-specific shocks).
4. Funding structure and efficiency:
Also, nonprofits with high NPISH consumption in relation to income may be perceived as offering more subsidized services within GDP data. To determine financial self-sufficiency, one could calculate the “earned revenue ratio,” which is calculated by dividing sales by total expenses. Another is the ratio of output to donated inputs (e.g., output per dollar donated). These can be obtained from IRS donation data and BEA input (expenses), although they aren’t GDP figures in and of themselves.
5. Composite indexes:
Furthermore, some analysts recommend combining BEA’s GDP and BLS employment statistics to create productivity indices for the nonprofit sector. Oftentimes, BEA’s suggested productivity accounting integrates BLS output data with GDP by industry. This might be modified for organizations to monitor production per hour worked over time. Although there isn’t a standard “nonprofit GDP deflator,” sectoral inflation metrics, such as the healthcare CPI, may serve as a proxy for changes in NP service prices.
6. Satellite indicators:
Lastly, since social impact is difficult to quantify, other measures can be added to GDP. For instance, GDP-based measures may be used in conjunction with outcomes (such as test scores at a nonprofit school), volunteer hours contributed, or population served per dollar, particularly when evaluating policies. In summary, Key indicators include:
GDP proportion of NPISH;
NP real GDP growth;
Nonprofit employment share and growth;
output per paid employee (and optional per volunteer hour); and
Let’s say a sizable nonprofit hospital spends $100 million a year on salaries, supplies, and other expenses. Overall, it receives $5 million from government programs and bills patients and insurance $80 million for services; the remaining $15 million is charity care funded by endowments or contributions.
In GDP: Gross output = $100 million. The $85 million paid for health care is included in household consumption. In this case, we assign $80 million to households and insurers and $5 million to government payments on behalf of households, which GDP regards as household spending. The $15 million in charitable treatment is shown as the final health service consumption for NPISH.
As a result, GDP sees $15M in nonprofit consumption and $80M + $5M in private consumption. The GDP contribution from health is $100 million. These flows appear in GDP revenue accounts (compensation $50M, net operating surplus, etc.) if the hospital also pays $50M in salaries and has a $2M investment (capital depreciation).
2. Nonprofit University
Secondly, a nonprofit institution spends $200 million annually on staff, upkeep, and research. Its revenue includes $20 million from endowment returns, $30 million from contributions, $120 million from tuition and fees, and $30 million from federal and state research grants. (Total revenue = $200 million equals expenses.)
GDP treatment: Depending on the source, the $120 million in tuition and $30 million in research grants count as household PCE on education services and as government consumption (because they fund instruction and research). NPISH spends the remaining $50 million on education through endowment and donation funding. Thus, $50 million appears as nonprofit consumption and $150 million as other people’s education spending.
To put it another way, output = $200M (based on costs); final consumption by NPISH = $200M–$150M = $50M.
3. Charitable Food Bank
Lastly, a charity food bank spends $10 million on operations and food. There are no costs. $4 million came from financial donations, $2 million from foundations, and $4 million from government funds. (A total of $10M was spent on 20 million lunches.)
GDP: NPISH produces all $10 million in food and services for low-income households. The full $10 million appears as final consumption expenditures of nonprofit organizations (food services) since households paid nothing. Note: GDP allocates this $10 million to the nonprofit’s output for households, even though it was funded by grants and contributions. That $10 million would include the market value of any in-kind food contributions that took place.
By and large, these examples demonstrate how nonprofit outputs show up in GDP through two different channels:
NPISH consumption when services are “free” and
Ordinary consumption spending when there is a fee.
Essentially, they reaffirm that GDP accounts for the costs of nonprofit outputs. In every instance, the nonprofit’s total spending (either as home consumption or NPISH consumption) is included in GDP.
Conclusion
All in all, Gross Domestic Product is intrinsically defective as a framework for assessing the nonprofit sector’s performance and social value. This is because it creates skewed performance incentives by rigidly evaluating output through input expenditures. Also, it treats the prevention of societal issues as a destruction of market revenue, describes operational efficiency as economic decline, and dismisses hundreds of billions of dollars in unpaid volunteer labor.
However, incorporating GDP principles into nonprofit organizations helps improve accountability and the sector’s inclusion in economic planning. While recognizing its blind spots, we should make the most of its analytical capabilities (particularly in unpaid labor).
In order to effectively govern contemporary economies, institutional leaders need to look beyond the GDP. Policymakers and management may more accurately assess and support the vital contributions made by the nonprofit sector with better data and innovative metrics.
In the current nonprofit environment, organizations are increasingly relying on technology to enhance donor interaction, ensure compliance, and streamline operations. The Pactman Nonprofit CheckPlus API […]
TABLE OF CONTENTS Introduction Overview of Nonprofit Grant Options Critical Statistics on Nonprofit Grants in the U.S. Nonprofit Grants in Washington Nonprofit Grants in Alabama […]
TABLE OF CONTENTS Introduction Nonprofit Funding Gaps in Africa Critical Statistics on Nonprofit Grants Local vs International Nonprofit Grants in Africa: A Comparative Analysis Overview […]
Most organisations prefer Asana as their management tool. It is especially useful for planning a client’s work, such as developing and updating a content calendar […]